It is not a SPoG. It’s SPiN.

Dear Manufacturer and Vendors,

I’ve been thinking about management tools, dashboards, and ‘Single Panes of Glass’ (SPOG) a lot recently. I’ve been considering what makes them useful, how they can be improved, and what I need in them. I’ve come to a conclusion:

I hate the term ‘Single Pane of Glass’ (SPoG).Your dashboard doesn’t even come close to that promise. Instead, you have delivered SPIN: Single PAIN in (my) Network.


Before building your next dashboard and calling it a SPoG, I suggest asking yourself these questions:

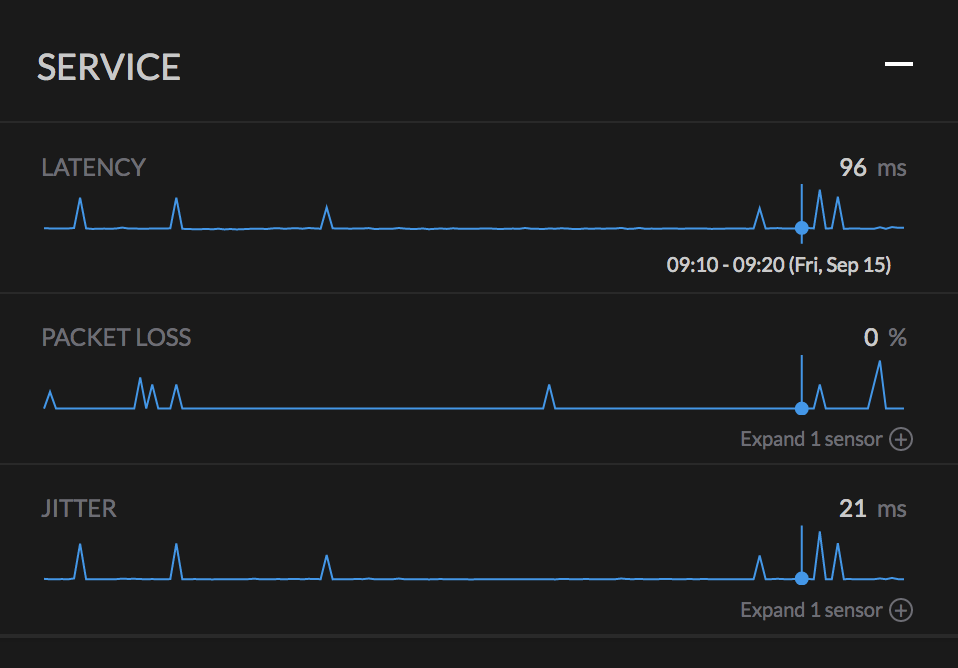
  1. Can my dashboard display information that exists outside of your product? None of us work on a single technology. We must work and understand more of the network or application stack. If you can’t provide basic reporting on those directly impacting layers that your product must rely on, it’s not a SPoG.
  2. Can the dashboard consume or interact with the API’s of your other dashboards? I get that you might avoid integrating closely with your competitors. However, if you can’t even integrate with the other system and dashboards provided by your own company, you have failed.
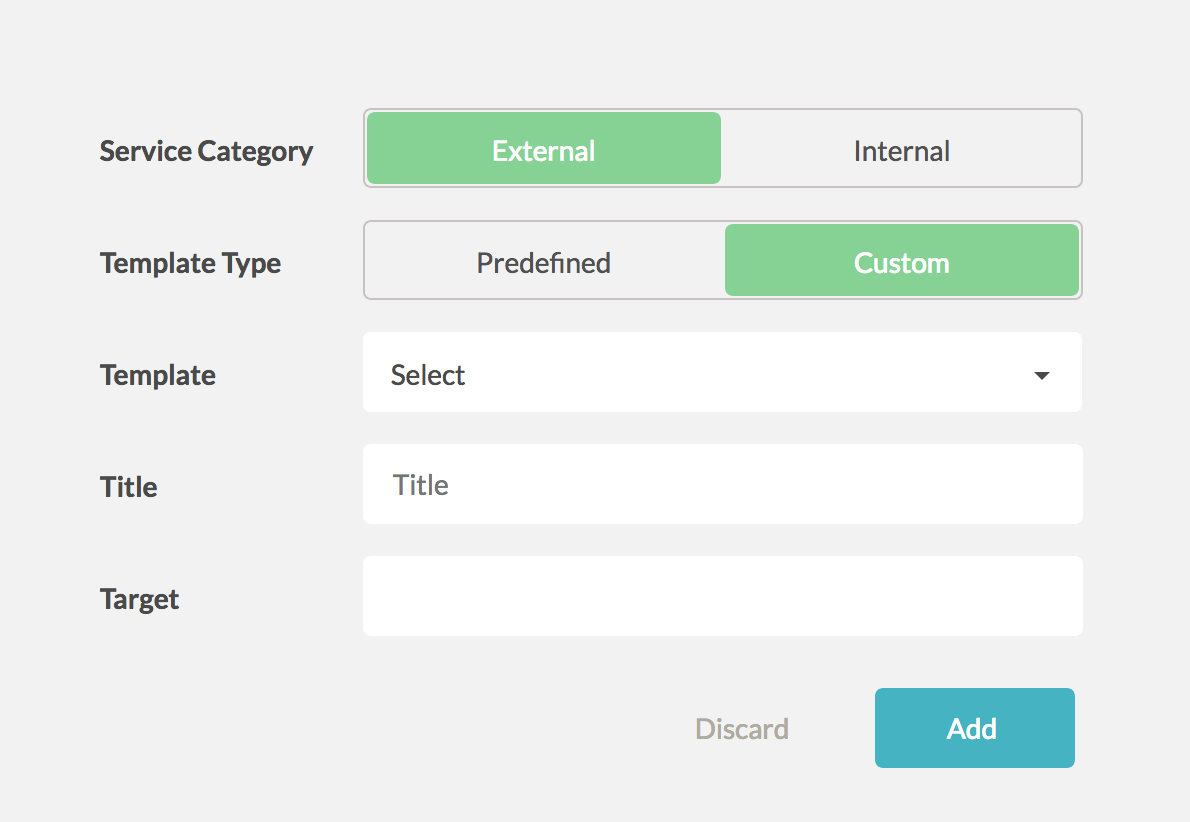
  3. Does the dashboard follow standard design rules and elements of all of your other dashboards and tools, or is this a one-off design that will require the average user to learn a whole new interface and the series of bugs that are sure to reveal themselves?
  4. Does your API follow a similar schema to your other applications and dashboards? You do have an API, right?
  5. Does your dashboard require custom licensing for each feature? If you spend more time developing licensing requirements than API’s, integration support with other products, or visibility of the other layers, it’s not a SPoG.

I get that many IT manufacturers have a vast inventory of products. I understand the question of “how much is too much information?” So, I would like to offer a few things to consider.

  1. Build a common API schema standard. Force all business units to adhere to it as closely as possible.
  2. Build a common aesthetic. Common menu types, common graph elements, standard filters, etc.
  3. To answer the question “how much is enough information,” I also have a suggestion. When building new certification exams, the first step is a Job Tasks Analysis (JTA). That process is about defining the common knowledge, tools, and methodologies used by someone in that role. A JTA should be the FIRST step in building new monitoring and management tools. That gathered data should drive every decision regarding tools, views, or information provided by your dashboard.

MFD3 – Link-Live Updates

This is the third blog from the Company-Previously-Known-As-Netscout’s session at Mobility Field Day 3. You can read about the AirCheck G2 v3.0 update and also the LinkRunner G2 v2.0 Update.

To catch you up, I came into MFD3 less enthusiastic than most regarding Netscout and their lineup of handheld network tools. With that said, I took notice in 2017 at MFD2 that the company was paying attention to feedback and looking for suggestions on how to improve their product offerings.

One of those improvements for MFD3 was a further expansion of the capabilities of Link-Live.

Link-Live has matured into a tool for consolidating all of your test results AND managing the tools at your disposal.

Many of these updates were covered in the LinkRunner and AirCheck updates, but bear repeating:

  • AirCheck software updates
  • AirCheck G2 Profile sharing
  • Packet capture sharing
  • Simplified App search for the LinkRunner G2
  • Files Folder – There is a lot more available that can be uploaded and saved to a project folder
  • Full AutoTest results

The most significant aspect of the Link-Live updates is a clear direction to make the LinkRunner and AirCheck entirely manageable without a Windows PC. This is a substantial shift from the past, and I am very excited to see it taking place because I stay away from Windows as much as possible.

So, the ultimate question, does the updates to the AirCheck G2 and LinkRunner G2, along with the new features of Link-Live make me change my opinion? Do I now see the ROI? Would I spend my budget, either personal or business on either tool?

The answer is “yes” to all of the above. With the divestiture of the handheld tools from Netscout into its own company, I expect the future to be bright. I think we will continue to see updates, new use cases, and great support. The handheld network tools team has won me over, and I’m happy to change my previous opinion. I will acquire both tools over the coming months for my personal toolkit, as I know my employer doesn’t have the budget. I don’t think there is more to say.

MFD3 – AirCheck G2 V3.0 Announcement

aircheckg2In case you missed it, MFD3 was an opportunity to reevaluate my opinion on the Aircheck G2 and LinkRunner G2. After my experiences at MFD2, I was no longer openly hostile towards the tools and saw that there was a legitimate desire to be open, fill the needs of users, and provide regular updates with new features.

As someone who identifies explicitly as a Wireless Network Engineer, the AirCheck G2 has been on my radar for a while, so I was interested, maybe even excited, about the opportunity to see the latest updates.

The AirCheck G2 v3.0 update adds:

  • Over-the-Network firmware updates – Sadly the V3.0 software update will have to be loaded from a PC, but from that point forward, a user with an active support contract can update the device directly.
  • Over-the-Network profile sharing – If your organization has more than one AirCheck G2, you can now ensure that everyone is testing using the same profile, all over-the-air through Link-Live.
  • Improved Link-Live interaction – manage device profiles, get test results, packet captures, etc.
  • Improved Locator Tool accuracy the Locator Tool now uses all three radio chains to enhance signal strength and accuracy
  • Enhanced AP name support – can now read AP names from Aerohive, Aruba, Cisco, Extreme Networks, and Huawei
  • Improved iPerf test performance – can now test using iPerf2, up to 300Mbps
  • Improved packet capture workflow – now users can be particular regarding the type of traffic they want to capture
  • Voice VLAN on ethernet test – if there is a voice VLAN assigned to the ethernet port, it will be displayed
  • Import certificates with a thumb drive – This simplifies importing certificates and is especially crucial for wireless engineers who might work at various customer sites.
  • Static IP’s can be assigned to the ethernet port
  • Other updates, which you should watch the video to see:


So, have I changed my mind? Am I ready to own a LinkSprinter G2 or AirCheck G2? Well, I think we should discuss Link-Live. That definitely factors into my decision.

MFD3 – LinkRunner G2 v2.0 Update

I have an admission to make. Before Mobility Field Day 2 of 2017, I was openly hostile towards the biggest player in the handheld network tools market. Through a series of lousy blue and gold experiences, I decided I no longer had room for those tools in my budget. Even after receiving a blue and gold LinkSprinter at a WLPC, I was apathetic at best.

But, I like reexamining my strongly held opinions. I believe that admitting I am wrong is much better than holding firmly to an incorrect conclusion.

linkrunnerSo, in 2017 when Netscout presented at MFD2, I got my opportunity to reconsider. They were working to expand the capabilities of the toolset, and they were open to feedback and requests for new features. I even considered purchasing an AirCheck G2, but ultimately found that I hadn’t budgeted for it. (Shocking!)

So, let’s fast forward to 2018 and MFD3. Over the two hour window Julio Petrovitch, from the handheld network tools group previously owned by Netscout, covered many topics, but the topics of most interest were the AirCheck G2 v3.0 and the LinkRunner G2 v2.0 software updates. So again, I got to reevaluate my opinion.

The very first revelation to me was this team now truly believes in updates! The LinkRunner was released last October, so approximately a year later they are adding features with v2.0. The announcement included significant new improvements and features, not just small dot revision updates and bug fixes.

The LinkRunner G2 v2.0 update adds:

  • 802.3bt support – provides both loaded and unloaded voltage and wattage reporting of class 5-8 PoE PSE equipment
  • Injector support – measures from 12-60 volts
  • More VLAN information – the LinkRunner G2 can provide lots of information regarding the VLAN’s that are accessible from a switchport; useful if you have ports configured with a voice and data VLAN.
  • Enhanced DHCP Test – Now supports providing information from DHCP Options 43, 60, and 150.
  • Auto Test Improvements – allows a user to refine how they would like a test to run.
  • VLAN Monitor Tool – plug the LinkRunner G2 into a trunk port and monitor all of the VLAN’s that are available and the amount of traffic broadcast on each
  • Packet Captures – or as Julio Petrovitch correctly called it frame captures. Plug the device into a mirror or span port and capture traffic directly to the LinkRunner G2.

One more note; the LinkRunner G2 can charge from PoE! That isn’t a new feature, but it was one that I missed. I am mentioning it here for those others who might also be unaware.

So, the real question, have I changed my mind about Netscout? Maybe, but first, I think we should discuss the AirCheck G2.

Watch the whole presentation and then tell me what you’re most excited about in the comments.


VIAVI Observer Apex- Finding the needle faster

I participated in the Tech Field Day Extra events at Cisco Live. One of the presenters, VIAVI has been floating near the edge of my awareness for a while, so it was great to see their presentation and get a better understanding of the VIAVI Observer Platform.

Anytime I see a presentation from a monitoring solution there are three questions that I ask:

“How useful would this be for tier one technicians?”

I usually consider that question from both the perspective of a NOC and also a helpdesk technician. If a monitoring tool isn’t practical for those roles, I am the one who gets stuck using it all of the time, and therefore, it has no place in my environment.

“How useful would this tool be for me?”

If the tool can’t offer enough information to be useful for a senior engineer, I don’t want to pay for it. It also increases the complexity of passing trouble tickets up the chain as each person has to start back at zero in their own tool.

“Does this make it easier to find the problem, or just add another step?”

Monitoring tools which only show up/down status and system logs have very little use for me. I can easily find those by other means, or on the device itself, faster than I can fire up a browser, click on a bookmark, log in, navigate through a device tree, etc.

VIAVI has provided the right answers to all three questions.

product-obsever-apex-welcome

The starting page for Observer is simple. It doesn’t take forever to load as it attempts to pull data from many different sources to provide a general health overview that rarely has anything to do with the reason you opened the application. Instead, Observer’s search box is ready for any relevant text the technician may know about the problem. If you have an IP, MAC address, VLAN, or hostname, those are all great places to start. You can also choose to push into a more generalized monitoring view like Application Performance, Network Performance, etc.

The search box is the beauty of the application for me. VIAVI indexes all of the monitoring sources for things like MAC addresses, IP addresses, interfaces, usernames, and other metadata and then correlates that information together. A technician doesn’t need to look up an IP address in the ARP table, get the MAC address, look up the MAC address in the MAC address table to get the port, then check the port for errors. A search on the IP address will provide all of that information, quickly! Since VIAVI also knows the assigned VLAN, it quickly displays “Here’s a bad actor on the same VLAN that is flooding the VLAN with bad frames.” The technicians can find problems without looking directly for them. That’s a huge win. This is not looking for a needle in a haystack. This is turning on an extremely powerful magnet and letting the needle come to you.

Another great feature is that Observer creates a baseline from the information that it acquires. With that baseline that understands system X typically runs at 75 percent utilization, but is now running at 90 percent, more problems quickly float to the surface. Additionally, the baseline filters out the normal abnormal. Is it “normal” for that system to run at 75 percent utilization all of the time? Maybe so. If it is, a technician doesn’t need a warning about it. It might be operating as designed.

If a technician can’t find a solution through the dashboard, the next engineer who picks up the problem will want to dig deeper. Thanks to the stored packet traces which provided all of the metadata the technician used, the engineer can take a look at the actual packets. Aside from the standard fields like source and destination, IP’s and ports, Observer also includes a patent-pending User Experience Score which is a 1-10 scale to aid in finding problems faster within the trace files.

Taking the click-through troubleshooting one step further, Observer creates Application Dependency Maps which aid an engineer to understand all of the dependent systems quickly and which are affecting performance.

When considering my initial three questions I proposed, I feel VIAVI’s Observer is providing pretty compelling answers for each. I look forward to learning more.

In many ways, Tech Field Day offers a similar solution to VIAVI Observer. TFD allows me to filter through the marketing hype, and get to the bottom of a product or solution and whether it will be useful to me. Don’t forget to check out the many other videos and content created by Tech Field Day at Cisco Live.

KRACK Attack Mitigation – A Call to Arms!

Ask any wireless engineer about the relationship with vendors who make the non-standard clients on their network and you’ll likely get a range of responses from quiet sobs to yelled expletives.

Problems ranging from bad driver or firmware updates, KRACK
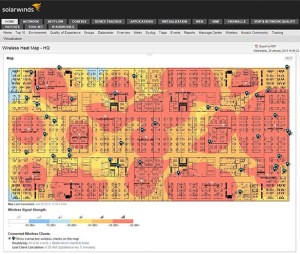
devices which don’t follow the 802.11 standard, and long delays in problem resolution are all part of the experience.

Often we may say to a customer “These clients are causing problems and here is proof. You should look at replacing them.” While the vendor of those products are telling that same customer “Your network sucks!”

With that in mind, I want to consider a few things as we begin the KRACK Attack mitigation.

  • Check CERT’s Vulnerability Notes Database for the status of vendor updates. This is a pretty extensive list, and is worth following:
    CERT’s Vulnerability Database
  • Some vendors will be VERY slow to issue patches. It is absolutely essential that we as wireless engineers who have the ability to approve devices refuse any new client deployments without the appropriate patches.
    Bring the security team into the discussion, and ensure that as a united front, unpatched clients are refused!
    Those who work in a sales role should warn all customers away from vendors who are not actively communicating their patch strategy, with clearly defined release dates. We should not send money to any company that doesn’t see resolving this as one of their highest priorities. Those companies should wither and die.
  • Many large enterprises have specific budgets for IT security related expenditures. If the budget isn’t available from teams responsible for the devices, check with the security team. They may have a budget that can be utilized.
  • Communicate to the vendors this week. Ask about patching schedules for KRACK. Ask to be included in weekly updates on the status until patches are released. Make it very clear that you see this as a high priority and are not willing to accept a “Maybe, eventually” patch schedule.

As a group of wireless engineers, we cannot accept anything less than appropriate patches which clearly mitigate KRACK.

Geek Tools – Cape Networks for more than just wireless

In case you missed it, a couple of weeks ago I wrote about my experience testing Cape Networks solution for wireless monitoring. You can find that post here. I first learned about Cape Networks at WLPC, and was able to have a conversation with them at Mobility Field Day 2 that you can watch here.

One point that continues to impress me about Cape Networks is the ability to test much more than WiFi.

It really comes down to the strength of the dashboard and the various tests that each sensor can run. The ability to test against internal and external systems is one example.

Screen Shot 2017-09-15 at 11.57.05 AM

Each sensor can test against web servers, iperf, or custom ports of your choosing.

Users can configure a test to run against predefined external websites like Adobe Creative Cloud, Microsoft Office 365, Dropbox, and others. But, the sensor can also test against custom websites, checking not just “Is it up?” but HTTP status codes and latency as well.

I’ve used this recently to help an outside vendor truly understand that “No, our network is not to blame” for the high latency their users are complaining about.

When all other external websites are seeing ~20ms latency, and your web application is averaging ~90ms over a period of weeks, guess what? YOU have a problem!

Screen Shot 2017-09-15 at 12.06.02 PM

Averaging 96ms of latency. Maybe that’s why the application is always slow?

Obviously, due to the nature of these tests being performed over WiFi, latency, jitter, and packet loss are all expected to be a bit higher, especially if they are performed during times of peak WiFi utilization. However, when you have tests to compare across multiple online services, it’s easy to notice standout patterns.

One feature request I would make to Cape Networks is this: Allow test to be ran across both the LAN and WiFi connections. If we can compare across these two mediums, we may also see additional information useful in diagnosing wireless issues.

Have you found a non-WiFi use for the Cape Networks sensors? If so, tell me about them in the comments.

As a MFD2 delegate, I did receive a free sensor from Cape Networks and various stickers and other low value (but tasty) snacks. All other expenses for MFD were covered by Tech Field Day. I was not compelled to write about Cape Networks in any way other than personal user experience. My employers decision to purchase sensors was based solely on the user experience and ease of problem resolution.

A Public Apology to Fluke Networks

In February I traveled to Phoenix to attend the Wireless LAN Professionals Conference (WLPC). It was an excellent conference with a ton of useful information and resources. One of the remarkable aspects of WLPC is that there are no corporate sponsors. All conference expenses are covered by attendees, and while vendors are encouraged to include items in the conference attendee bag, they are no booths, booth babes or trolls. I am certain some attendees would rather run booth to booth grabbing tchotchkes and attempting to avoid getting their badges scanned. I find the WLPC model refreshing.

At this years conference the organizers tried something new. Once the conference was done for the day, they opened the conference rooms for vendors to host attendees. Dinner or drinks were usually provided.

It was during one of these events that I overstepped an invisible, but clearly present line of professionalism, and I recognize that I owe a public apology to Fluke Networks. During their evening session, when things became slow for a moment, I took the opportunity to ask a question. I don’t remember the conversation verbatim, but my question was something like: “When will the Mac client be released?”

A simple question right? Only, the answer I got somehow exposed some raw emotions, and those emotions fueled my responses. I managed to completely side-track their session by asking for attendee participation in straw poles:
“Raise your hand if you want a Mac version.”

I mocked their walking man pointer used during surveys as a waste of CPU resources, when all I needed was crosshairs, and I continue on ranting and raving for a few more minutes. I acted like a drunk heckler, only I can’t blame alcohol.

As soon as my rant slowed, I realized I had fueled the crowd, and as other people began to chime in, I watched them reinforce my points and I sat there feeling vindicated; feeling great about delivering a bit of honesty and a big dose of reality. Their session never got back on track, but I will say the Fluke Networks team handled it with aplomb.

I now recognize that I needed a big dose of humility in that moment, not vindication. 

I’ve thought about that discussion a lot since it happened, which is what led to this blog post. Ultimately, that was the wrong venue for the conversation that I forced on them. I sat there with a belly full of food that they had graciously provided, and I completely derailed their conversation. My apologies to the Fluke Team in attendance. My apologies to the other attendees who might have been sitting there hoping for the very product walkthrough that Fluke was providing.

My blog IS the correct venue for the discussion. My passion for technology, networking, and specifically wireless fueled the rant and I plan to outline some of my frustrations in an upcoming blog post. The response I received that fueled my rant was one of disconnect. “Why would you want that?” Again, certainly not verbatim, but that was the message. I hope to start a conversation rather than rant into the void. With that in mind, I will lay out the case, and then I will put this to rest.

GeekTools: SolarWinds Wireless Heat Maps

Ever changing environments are the biggest problem that wireless engineers face. A new site can be surveyed, and based on that, an ideal wireless design can be created for the space providing perfect signal, overlap, and SNR; the wireless engineer leaves the site, SolarWinds NPM Wireless Heat Mapsmoving on to the next assignment, and that perfect design last through the weekend. Now the engineer is located in a different state, working on a different project, and is getting calls from the customer.

“Hey, we have problems, and I need you to fix them.” the customer says.
“Ok, can you describe the problem for me?” the engineer ask. Secretly, the engineer is shocked the customer is calling for any reason other than to laude the engineers talent, foresight, and general awesomeness.
“None of our customers can connect in the waiting area.” states the customer with disapproval.

Generally, troubleshooting this type of problem is straight forward. A quick look for interferers, a check to ensure all equipment is still functioning, and a general eye for anything that has changed. As a nod to the possibility of a changed environment, a simple question is asked.

“Has anything at the site changed? the engineer queries.
“Of course not” is the answer the customer provides, voice now dripping with disappointment.

Thus, the engineer continues to dig further.

Large enterprise organizations who deploy Cisco hardware generally keep maps for each facility in Cisco Prime. Smaller organizations without the budget or time to assign to Prime can find themselves looking for a different solution.

SolarWinds has a new solution that is part of NPM 11.5 and it is worth investigating. They now offer wireless heat maps. The simplicity of setting up the heat maps makes it easy for under-staffed shops to use the tool effectively. Import the floor plan, set scale, and then drag the AP’s supplied by the Cisco WLAN Controller onto the map into the correct locations. Once the AP’s are placed, the software makes a best-guess of wireless coverage. This is a standard but flawed practice.

The issue lies in physical placement of the AP’s within their environment. The AP’s are all at ceiling height, above cube walls, water features, whiteboards, and many other sources of signal degradation. The clients are on a much lower plane, and therefor see a different footprint.

SolarWinds solves this issue by allowing an engineer to place known clients on the map, and then use those to further improve the heat map. This provides a tool that can be used to understand what is happening at standard client heights, where signal matters.

“Oh look, now I see a huge null in the coverage.” the engineer says. “Are you sure there haven’t been any changes near the AP I placed by the receptionist desk?
“Oh, that’s right. We hung the sign this weekend” says the customer.
“That large metal sign that was in the shop area last week?” ask the engineer.
“Yeah, that’s the one, We suspended it from the ceiling right over the receptionist. It looks awesome. That wouldn’t cause this problem would it?”

The engineer proceeds to bang his head against the desk with a dull thud, thud, thud.
*Names have been changed to protect the identities of those responsible*

Watch SolarWinds discussing their wireless heat maps at Network Field Day 9 here: (Heat map discussion starts at 19:40)

-I participated in Network Field Day 9 as a delegate. As part of that participation, the cost of all travel and accommodations were covered. Additionally, some companies chose to give delegates small gifts for their participation. These accommodations do not in any way constitute a requirement for coverage, good or bad. In short, I am an opinionated jerk,  I was invited despite that, and anything I write is purely my own opinion. Special thanks to Tech Field Day, for the service they provide to engineers and vendors. If you would like to be a delegate at a future event, you can learn more here.  

Geek Tools – SSH and Telnet on OS X

Since I made the switch to a Mac in my day job, I’ve had two major frustrations. The first is the lack of Visio for OS X. The second one, was a little more major. I needed a replacement for MRemoteNG. I’ve searched for options and grown weary of reading the general post of “why would you need a specialized SSH tool, when it is built into the terminal of OS X?”

That statement is usually offered by a web developer who might have SSH connections to 3-5 servers on a daily basis. They live in a very specific world, and have a hard time understanding anything outside of that world. Feel bad for them; don’t hate them.

In the world of network engineers however, we may connect to 50 or more devices in a day, and may have logins to thousands of devices over an enterprise network. In that environment, there is a real need for the ability to bookmark devices.

After searching for options, I found one option that worked to some extent. This SSH workflow for Alfred is excellent. However, since I use a hosts file from someonewhocares.org to block a lot of advertisers and trackers, the index was never very useful.

After considering this problem from all angles, I finally had an “AH HA!” moment, and the simplicity of the solution made me equal parts giddy and disappointed that it took me so long to resolve. I created a file with a similar layout to a hosts file, in-fact I even named it hosts.txt. Each row of the file list a hostname, and an IP address. Since this file is purely text, you could add anything to each line that you wanted. 

#site1
device1 10.0.1.1 description
device2 10.0.1.2 unique protocol info
device3 10.0.1.3 more information
device4 10.0.1.4
#site2
device1 10.0.2.1
device2 10.0.2.2
device3 10.0.2.3
device4 10.0.2.4
device5 10.0.2.5
#site3
device1 10.0.3.1
#site4
device1 10.0.4.1
device2 10.0.4.2

But how does this help us manage thousands of devices you ask? It doesn’t, but grep does. If we pass a search string to grep along with the file name, all matching hosts show up. Yes it is simple, but it is useful because of that!

In my file, I created a site heading by starting the line with an octothorpe. I use this so that I can search for sites. This looks like:

grep ^# hosts.txt
#site1
#site2
#site3
#site4

I can also search for all devices at a location using a statement like:

grep ^#site2 -A6 hosts.txt
#site2
device1 10.0.2.1
device2 10.0.2.2
device3 10.0.2.3
device4 10.0.2.4
device5 10.0.2.5
#site3

In this case, I am telling it to start at “#site2” and show the next 6 lines. Since the 6th line is the next site, I know that I am seeing all of the devices from site 2.

Finally, if I know part of the hostname, I can simply search on it, and it will display.

Hopefully this gives you a better way of managing huge networks from terminal.